Understand itTrace one endpoint: validate counts → compare compatible studies.
Input: counts + definitions
↓Process: validation, compatibility
↓Output: board + CSV
Choose toolsPython validation, HTML/SVG board.
Python csvHTML + SVGNo LLM
Build itPaste the brief into OpenCode and confirm zero tested gives no percentage.
OpenCode · development brief
Build an endpoint board: validate integer counts and affected_n ≤ tested_n, keep controls separate, show proportions beside denominators, compare only compatible units and export.▎
Inspect aquatic toxicity endpoints by dose and timeSource & credit
Inspect aquatic toxicity endpoints by dose and time: Trace one endpoint: validate counts → compare compatible studies.
Every percentage next to its denominator. Owner-supplied illustrative interface; source figures credited below.
Zhao et al. 2016, PLoS ONE 11:e0160763, Fig. 4 — CC BY 4.0 (https://journals.plos.org/plosone/article/figure/image?size=large&id=10.1371/journal.pone.0160763.g004)
Owner-supplied illustrative interface; source figures credited below.
Understand itTrace one interval: continuity → projection → label.
Input: tracks + axis
↓Process: projection onto axis
↓Output: trajectory + segments
Choose toolsTrackMate optional, JavaScript/SVG.
TrackMate (optional)JavaScript + SVGNo LLM
Build itPaste the brief into OpenCode and run the axis-reversal test.
OpenCode · development brief
Build a growth-cone trajectory viewer: project displacements onto a user-defined axis, label extension and retraction, preserve gaps, allow point revision and export segments.▎
Review extension and retraction at a growth coneSource & credit
Review extension and retraction at a growth cone: Trace one interval: continuity → projection → label.
Forward is what the reviewer says it is. Owner-supplied illustrative interface; source figures credited below.
Dema et al. 2023, eLife 12:e84143, Fig. 5A — CC BY 4.0 (https://iiif.elifesciences.org/lax:84143%2Felife-84143-fig5-v2.tif/full/full/0/default.jpg)
Owner-supplied illustrative interface; source figures credited below.
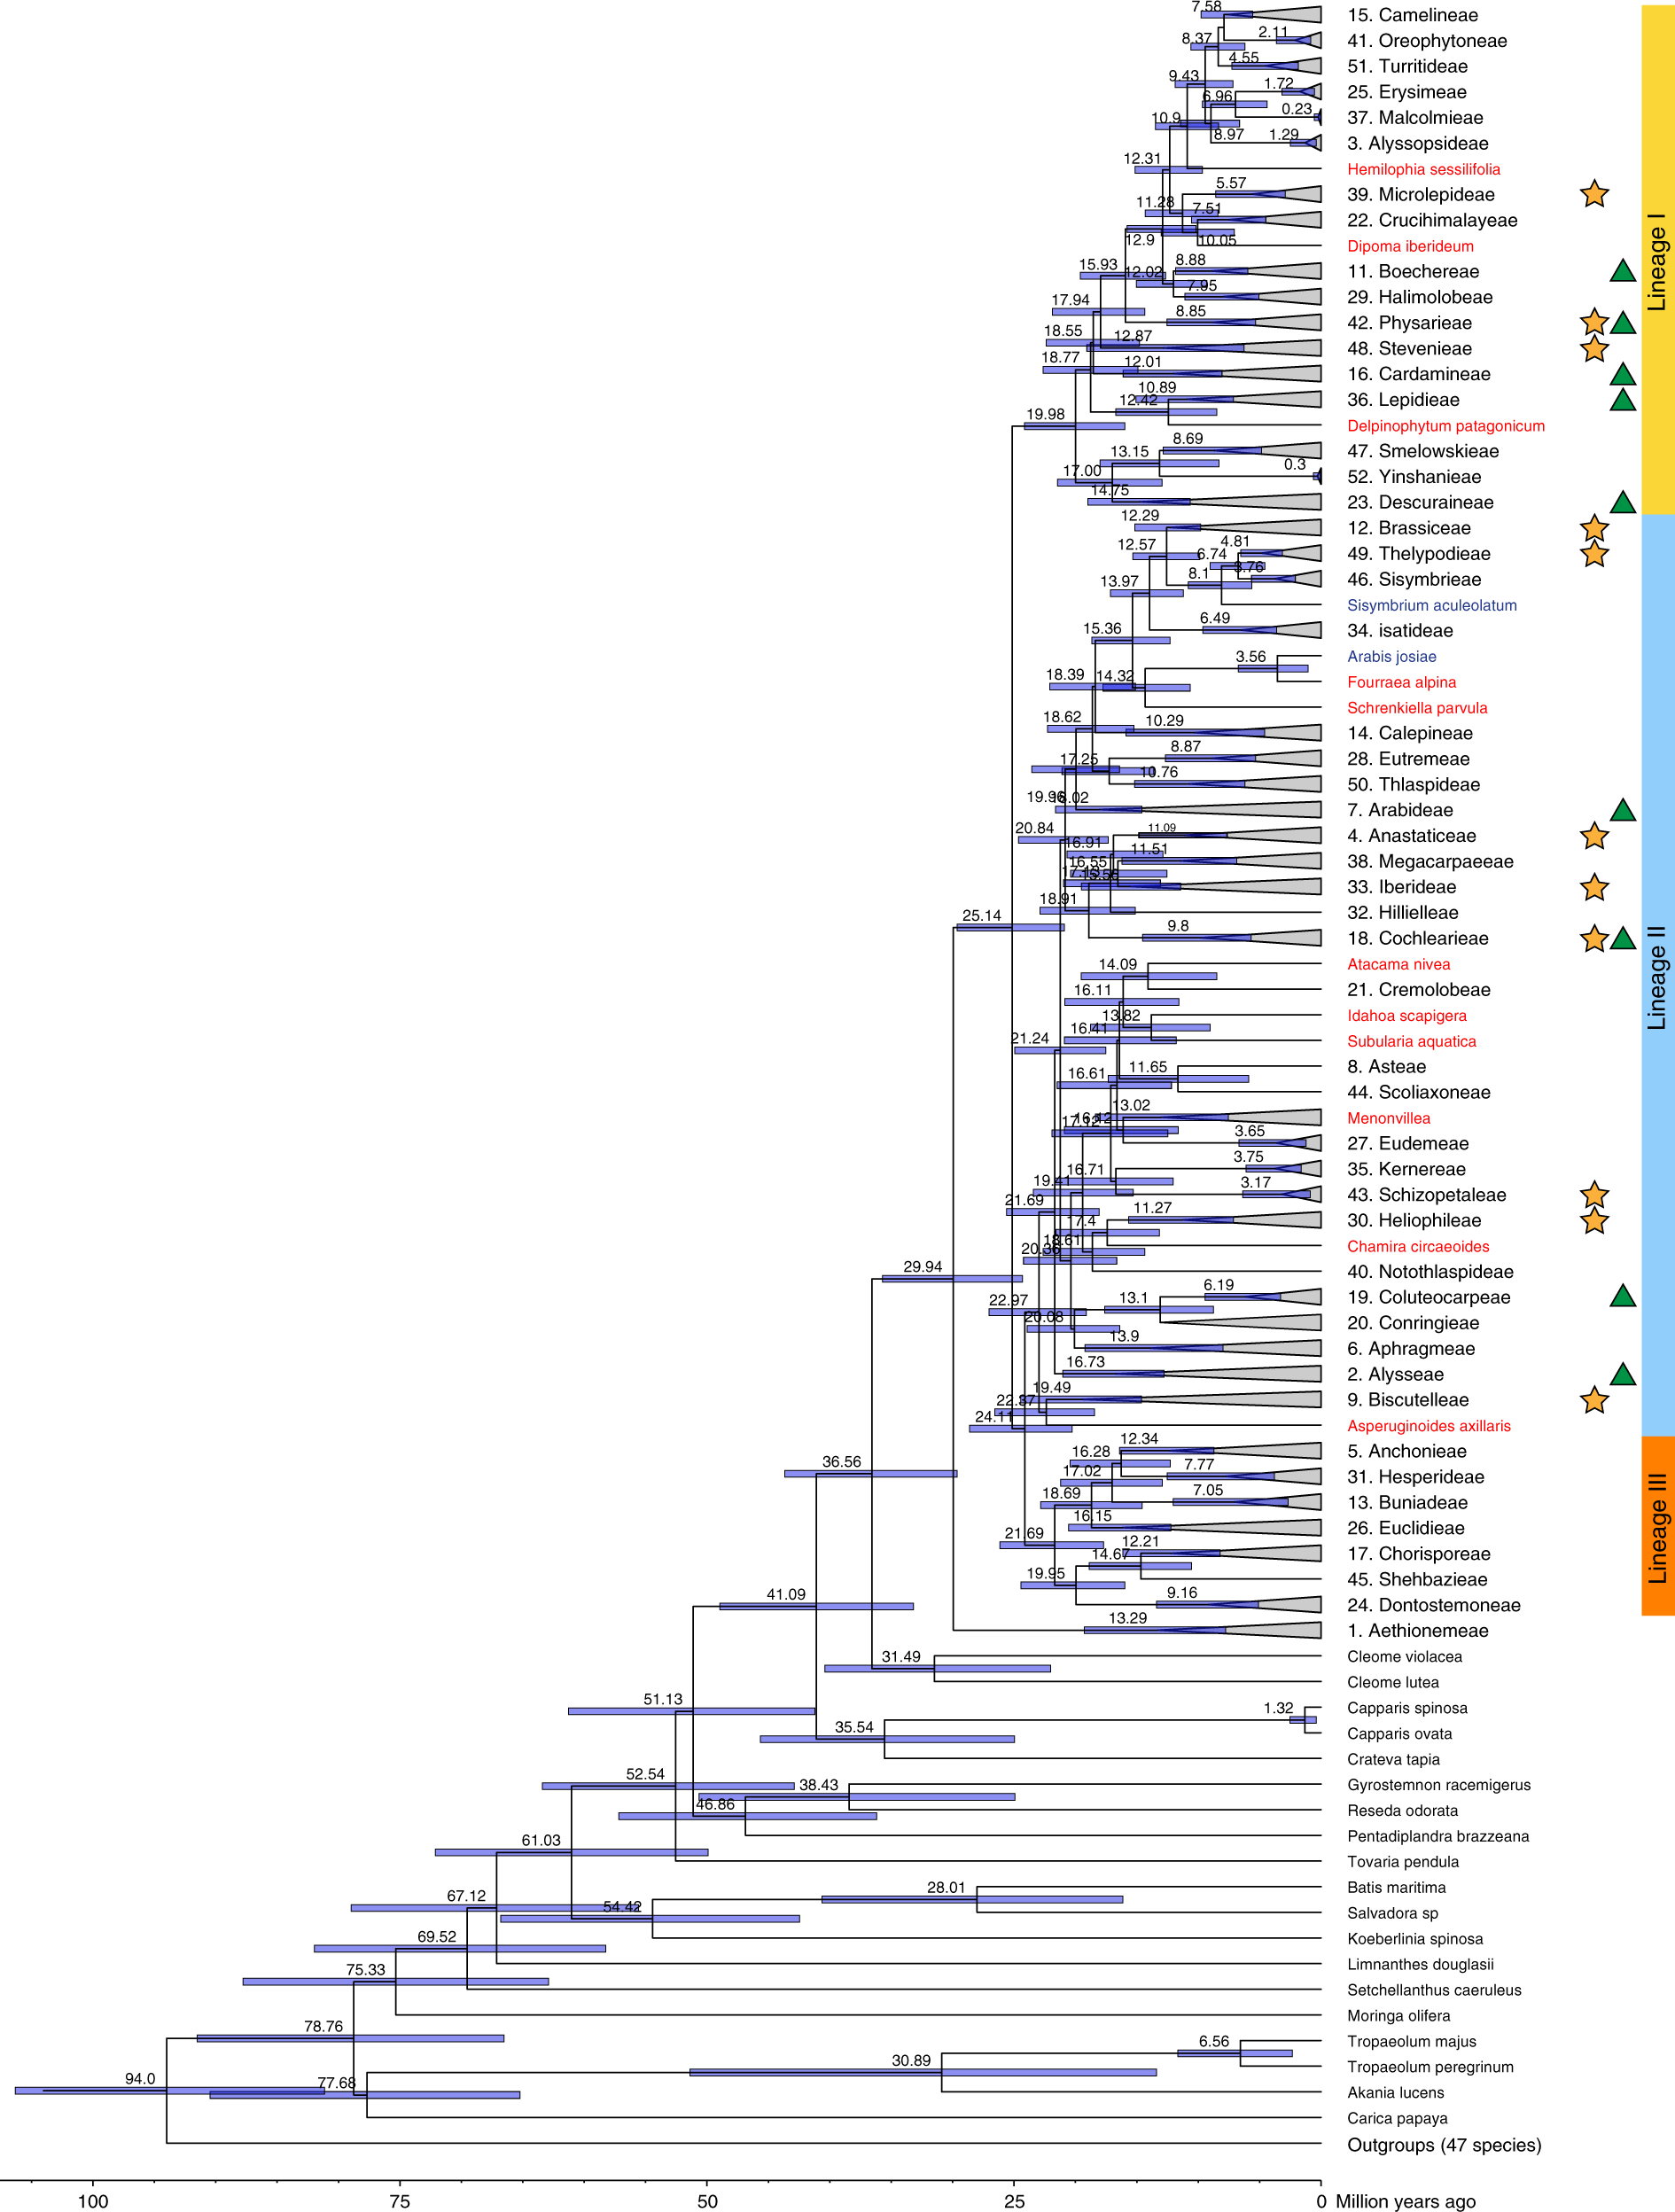
Understand itTrace a clade: validate tip IDs → draw the fixed tree → select a node → list exactly its descendants.
Input: supplied tree + tip metadata
↓Process: validate, traverse, colour by support band, draw HPD bars
↓Output: annotated tree + clade membership CSV
Choose toolsJavaScript and SVG only; no phylogenetic inference is performed or implied.
JavaScript + JSON — traversalSVG — tree, support dots, HPD bars, time axisNo LLM, no inference software
Build itPaste the brief into OpenCode and verify exported clade members equal the supplied descendants.
OpenCode · development brief
Build a phylogeny inspector for a supplied nested-JSON tree with tip metadata. Show branch lengths on a time axis, node support as a colour band with a legend, age intervals as bars, and clade selection that lists and ex▎
Inspect a mustard-family phylogeny and its supportSource & credit
Inspect a mustard-family phylogeny and its support: Trace a clade: validate tip IDs → draw the fixed tree → select a node → list exactly its descendants.
A fixed tree, with its support visible. Owner-supplied illustrative interface; source figures credited below.
Walden et al. 2020, Nat Commun 11:3795, Fig. 1 — dated Brassicaceae tree, CC BY 4.0 (https://media.springernature.com/full/springer-static/image/art%3A10.1038%2Fs41467-020-17605-7/MediaObjects/41467_2020_17605_Fig1_HTML.png)
Hendriks et al. 2023, Curr Biol — CC BY-NC-ND (no cropping; do not use as hero) (https://doi.org/10.1016/j.cub.2023.08.026)
Andreas Franzke, COS Biodiversity and Plant Systematics (https://www.cos.uni-heidelberg.de/en/research-groups/biodiversity-and-plant-systematics/dr-andreas-franzke)
Owner-supplied illustrative interface; source figures credited below.
Understand itTrace one profile: compatible → normalise → compare.
Input: profiles
↓Process: basis-aware normalisation
↓Output: profile plots + summary CSV
Choose toolsPython summaries, SVG plots.
Python csvHTML + SVGNo LLM
Build itPaste the brief into OpenCode and confirm the detector-signal profile is refused DPn.
OpenCode · development brief
Build a profile explorer: show raw and normalised DP profiles, refuse to mix abundance bases, compute number-average DP only for molar data and export.▎
Choose toolsPython for window summaries, SVG for linked plots; no automatic fitting unless the model is named.
Python csv — baseline and window calculationsHTML + SVG — sweep selection and I–V plot with hoverNo LLM
Build itPaste the brief into OpenCode and check that the clipped sweep is flagged and excluded from the plot.
OpenCode · development brief
Build a patch-clamp review app from sweeps.csv. Let the user choose baseline and measurement windows, show raw and corrected traces, flag clipped or missing samples, compute a per-sweep mean only from the chosen valid wi▎
Inspect ion-channel currents across voltage stepsSource & credit
Inspect ion-channel currents across voltage steps: Trace one sweep: pick a baseline window → subtract → measure the declared window → place one point on the I–V plot.
Sweeps first, then the I–V curve. Owner-supplied illustrative interface; source figures credited below.
Martin et al. 2024, eLife 13:e94342, Fig. 3 — Kv1.8 current families and G–V, CC BY 4.0 (https://iiif.elifesciences.org/lax:94342%2Felife-94342-fig3-v1.tif/full/full/0/default.jpg)
Bohannon et al. 2020, eLife 9:e51453, Fig. 3 — Nav1.5 sweeps and I–V, CC BY 4.0 (https://iiif.elifesciences.org/lax:51453%2Felife-51453-fig3-v2.tif/full/full/0/default.jpg)
Frank Möhrlen, COS (https://www.cos.uni-heidelberg.de/en/node/21/animal-molecular-physiology/dr-frank-mohrlen)
Owner-supplied illustrative interface; source figures credited below.
Build itPaste the brief into OpenCode and confirm occupancy is not computed for the missing case.
OpenCode · development brief
Build a peptide-evidence viewer: join peptides to proteins, keep peptide and protein levels distinct, show modified/unmodified signals with replicates, refuse occupancy when the unmodified signal is missing and export.▎
Compare N-terminal acetylation under plant stressSource & credit
Compare N-terminal acetylation under plant stress: Trace one peptide: comparable signals → replicates → candidate rows.
Missing unmodified signal is not zero occupancy. Owner-supplied illustrative interface; source figures credited below.
Linster et al. 2015, Nat Commun 6:7640, Fig. 4 — CC BY 4.0 (https://media.springernature.com/full/springer-static/image/art%3A10.1038%2Fncomms8640/MediaObjects/41467_2015_Article_BFncomms8640_Fig4_HTML.jpg)
Owner-supplied illustrative interface; source figures credited below.
Build itPaste the brief into OpenCode, drop pUC19 in, and compare the cut sites with the NEB list for three enzymes.
OpenCode · development brief
Build a plasmid map viewer: drag-and-drop GenBank or FASTA, circular and linear views, feature table, ORF finder, an enzyme picker that draws cut sites, and PNG/SVG export. Show the file's own annotation source and never▎
Plasmid map viewerSource & credit
Plasmid map viewer: Trace a file through the app: parse → features and ORFs → circular and linear map → cut sites for the chosen enzymes.
Builds on: SeqViz (MIT) + seqparse for GenBank; pUC19 L09137 from NCBI
Hero recipe: Wikimedia 'PUC19.svg' (public domain) or a rendered SeqViz circular map
Must not claim: Never claims a construct 'will work'; restriction map is only as good as the enzyme list.
Owner-supplied illustrative interface; source figures credited below.
Research workflows
qPCR ΔΔCt calculator
Paste the brief into OpenCode and run the reference dataset; the fold changes must match the package output.
Understand itTrace one gene: Ct → ΔCt vs reference → ΔΔCt vs calibrator → fold change, with replicate SD carried through.
Input: Ct values + well map + config
↓Process: Livak or Pfaffl, replicate statistics, missing-Ct handling
↓Output: fold-change table with SD and a bar chart with replicate dots
Choose toolsPlain code and a chart library; no LLM; the R package as the reference implementation for tests.
JavaScript or Python — the arithmeticSVG chart — bars with replicate dotsR 'pcr' package — cross-check numbers
Build itPaste the brief into OpenCode and run the reference dataset; the fold changes must match the package output.
OpenCode · development brief
Build a qPCR ΔΔCt calculator: load a plate CSV and well map, choose reference gene and calibrator, compute Livak and Pfaffl fold changes with replicate SD, flag undetermined Cts, and export the table and a bar chart with▎
qPCR ΔΔCt calculatorSource & credit
qPCR ΔΔCt calculator: Trace one gene: Ct → ΔCt vs reference → ΔΔCt vs calibrator → fold change, with replicate SD carried through.
Builds on: Pure JS/Python math (Livak 2^-ΔΔCt and Pfaffl); test data from the R 'pcr' package (GPL-3, paper CC BY)
Hero recipe: Wikimedia 'QPCR results – amplification plot and melting curves' (CC BY-SA 4.0) or a rendered bar chart with replicate dots
Must not claim: No significance claims without a named test; no MIQE compliance claim; efficiency only from a supplied standard curve.
Owner-supplied illustrative interface; source figures credited below.
Cell biology & imaging
Western blot band densitometer
Paste the brief into OpenCode and check the ImageJ sample gel gives lane ratios consistent with ImageJ's gel analyser.
↓Output: per-lane table with raw, background, normalised values and a saturation flag
Choose toolsscikit-image for the image maths, SVG for profiles; no LLM.
scikit-image + NumPy — profiles and backgroundSVG — lane profile with the integrated peak shadedNo LLM
Build itPaste the brief into OpenCode and check the ImageJ sample gel gives lane ratios consistent with ImageJ's gel analyser.
OpenCode · development brief
Build a blot densitometer: load an image, draw or auto-detect lane boxes, plot intensity profiles, subtract background, integrate band peaks, normalise to a chosen loading-control lane, flag saturated pixels, and export ▎
Western blot band densitometerSource & credit
Western blot band densitometer: Trace one lane: box → intensity profile → background subtraction → peak area → normalised to the control lane.
Western blot band densitometer Owner-supplied illustrative interface; source figures credited below.
Builds on: scikit-image (BSD-3), NumPy/SciPy; ImageJ 'gel.gif' sample (public domain)
Hero recipe: Wikimedia 'Western Blot.jpg' (CC0) with rendered lane profiles
Must not claim: No linear-range claim without a dilution series; no absolute protein amounts.
Owner-supplied illustrative interface; source figures credited below.
Cell biology & imaging
Flow cytometry gating lite
Paste the brief into OpenCode, load the sample file and reproduce one population count from the FlowJo workspace.
Understand itTrace the data: parse → transform (logicle) → draw two gates → report population percentages with their parent gate.
Input: .fcs + panel
↓Process: parse, transform, gate, count
↓Output: scatter plots with gates, population table, GatingML export
Choose toolsFlowKit for parsing and GatingML, a canvas for plots; no LLM.
FlowKit / FlowIO — parsing, transforms, GatingMLCanvas or SVG — density scatter and polygon gatesNo LLM
Build itPaste the brief into OpenCode, load the sample file and reproduce one population count from the FlowJo workspace.
OpenCode · development brief
Build a flow-cytometry viewer: load an .fcs file, apply a logicle transform, draw rectangle and polygon gates on chosen channels, show population counts and percentages with their parent gate, and export GatingML 2.0. Wa▎
Flow cytometry gating liteSource & credit
Flow cytometry gating lite: Trace the data: parse → transform (logicle) → draw two gates → report population percentages with their parent gate.
Builds on: FlowKit + FlowIO (BSD-3); FlowKit sample FCS files and FlowJo workspace
Hero recipe: Rendered logicle scatter with two polygon gates; Wikimedia 'Cytometer.svg' (CC BY 3.0) as an icon
Must not claim: No compensation claims without a spillover matrix; no clinical use.
Owner-supplied illustrative interface; source figures credited below.
Genomics & molecular biology
AlphaFold confidence inspector
Paste the brief into OpenCode, fetch P69905 and compare the pLDDT track with the AlphaFold DB page.
Understand itTrace one protein: pLDDT per residue → confidence bands → PAE matrix → segments worth trusting.
Input: pLDDT and PAE from AlphaFold DB
↓Process: band residues, cluster PAE blocks, list segments
↓Output: pLDDT track, PAE heatmap, 'trusted segments' table, link to the 3D view
Choose toolsLive API + SVG; the existing Mol* example handles 3D; no LLM.
AlphaFold DB API — predictions (CC BY 4.0)UniProt REST — sequence and namesSVG — track and heatmap with hover
Build itPaste the brief into OpenCode, fetch P69905 and compare the pLDDT track with the AlphaFold DB page.
OpenCode · development brief
Build an AlphaFold confidence inspector: enter a UniProt ID, fetch pLDDT and PAE, draw a per-residue pLDDT track coloured by confidence band, a PAE heatmap, and a table of contiguous high-confidence segments. Cite the Al▎
AlphaFold confidence inspectorSource & credit
AlphaFold confidence inspector: Trace one protein: pLDDT per residue → confidence bands → PAE matrix → segments worth trusting.
Builds on: AlphaFold DB API (predictions CC BY 4.0), UniProt REST
Hero recipe: Rendered pLDDT track + PAE heatmap for a real UniProt entry (e.g. P69905)
Must not claim: No accuracy, binding or function claims; low pLDDT is 'low confidence', not disorder.
Owner-supplied illustrative interface; source figures credited below.

.jpg)


